| dash.json | ||
| docker-compose.yml | ||
| prometheus.yml | ||
| README.md | ||
discord-nerd-stats
Docker compose resources for standing up a discord monitoring stack
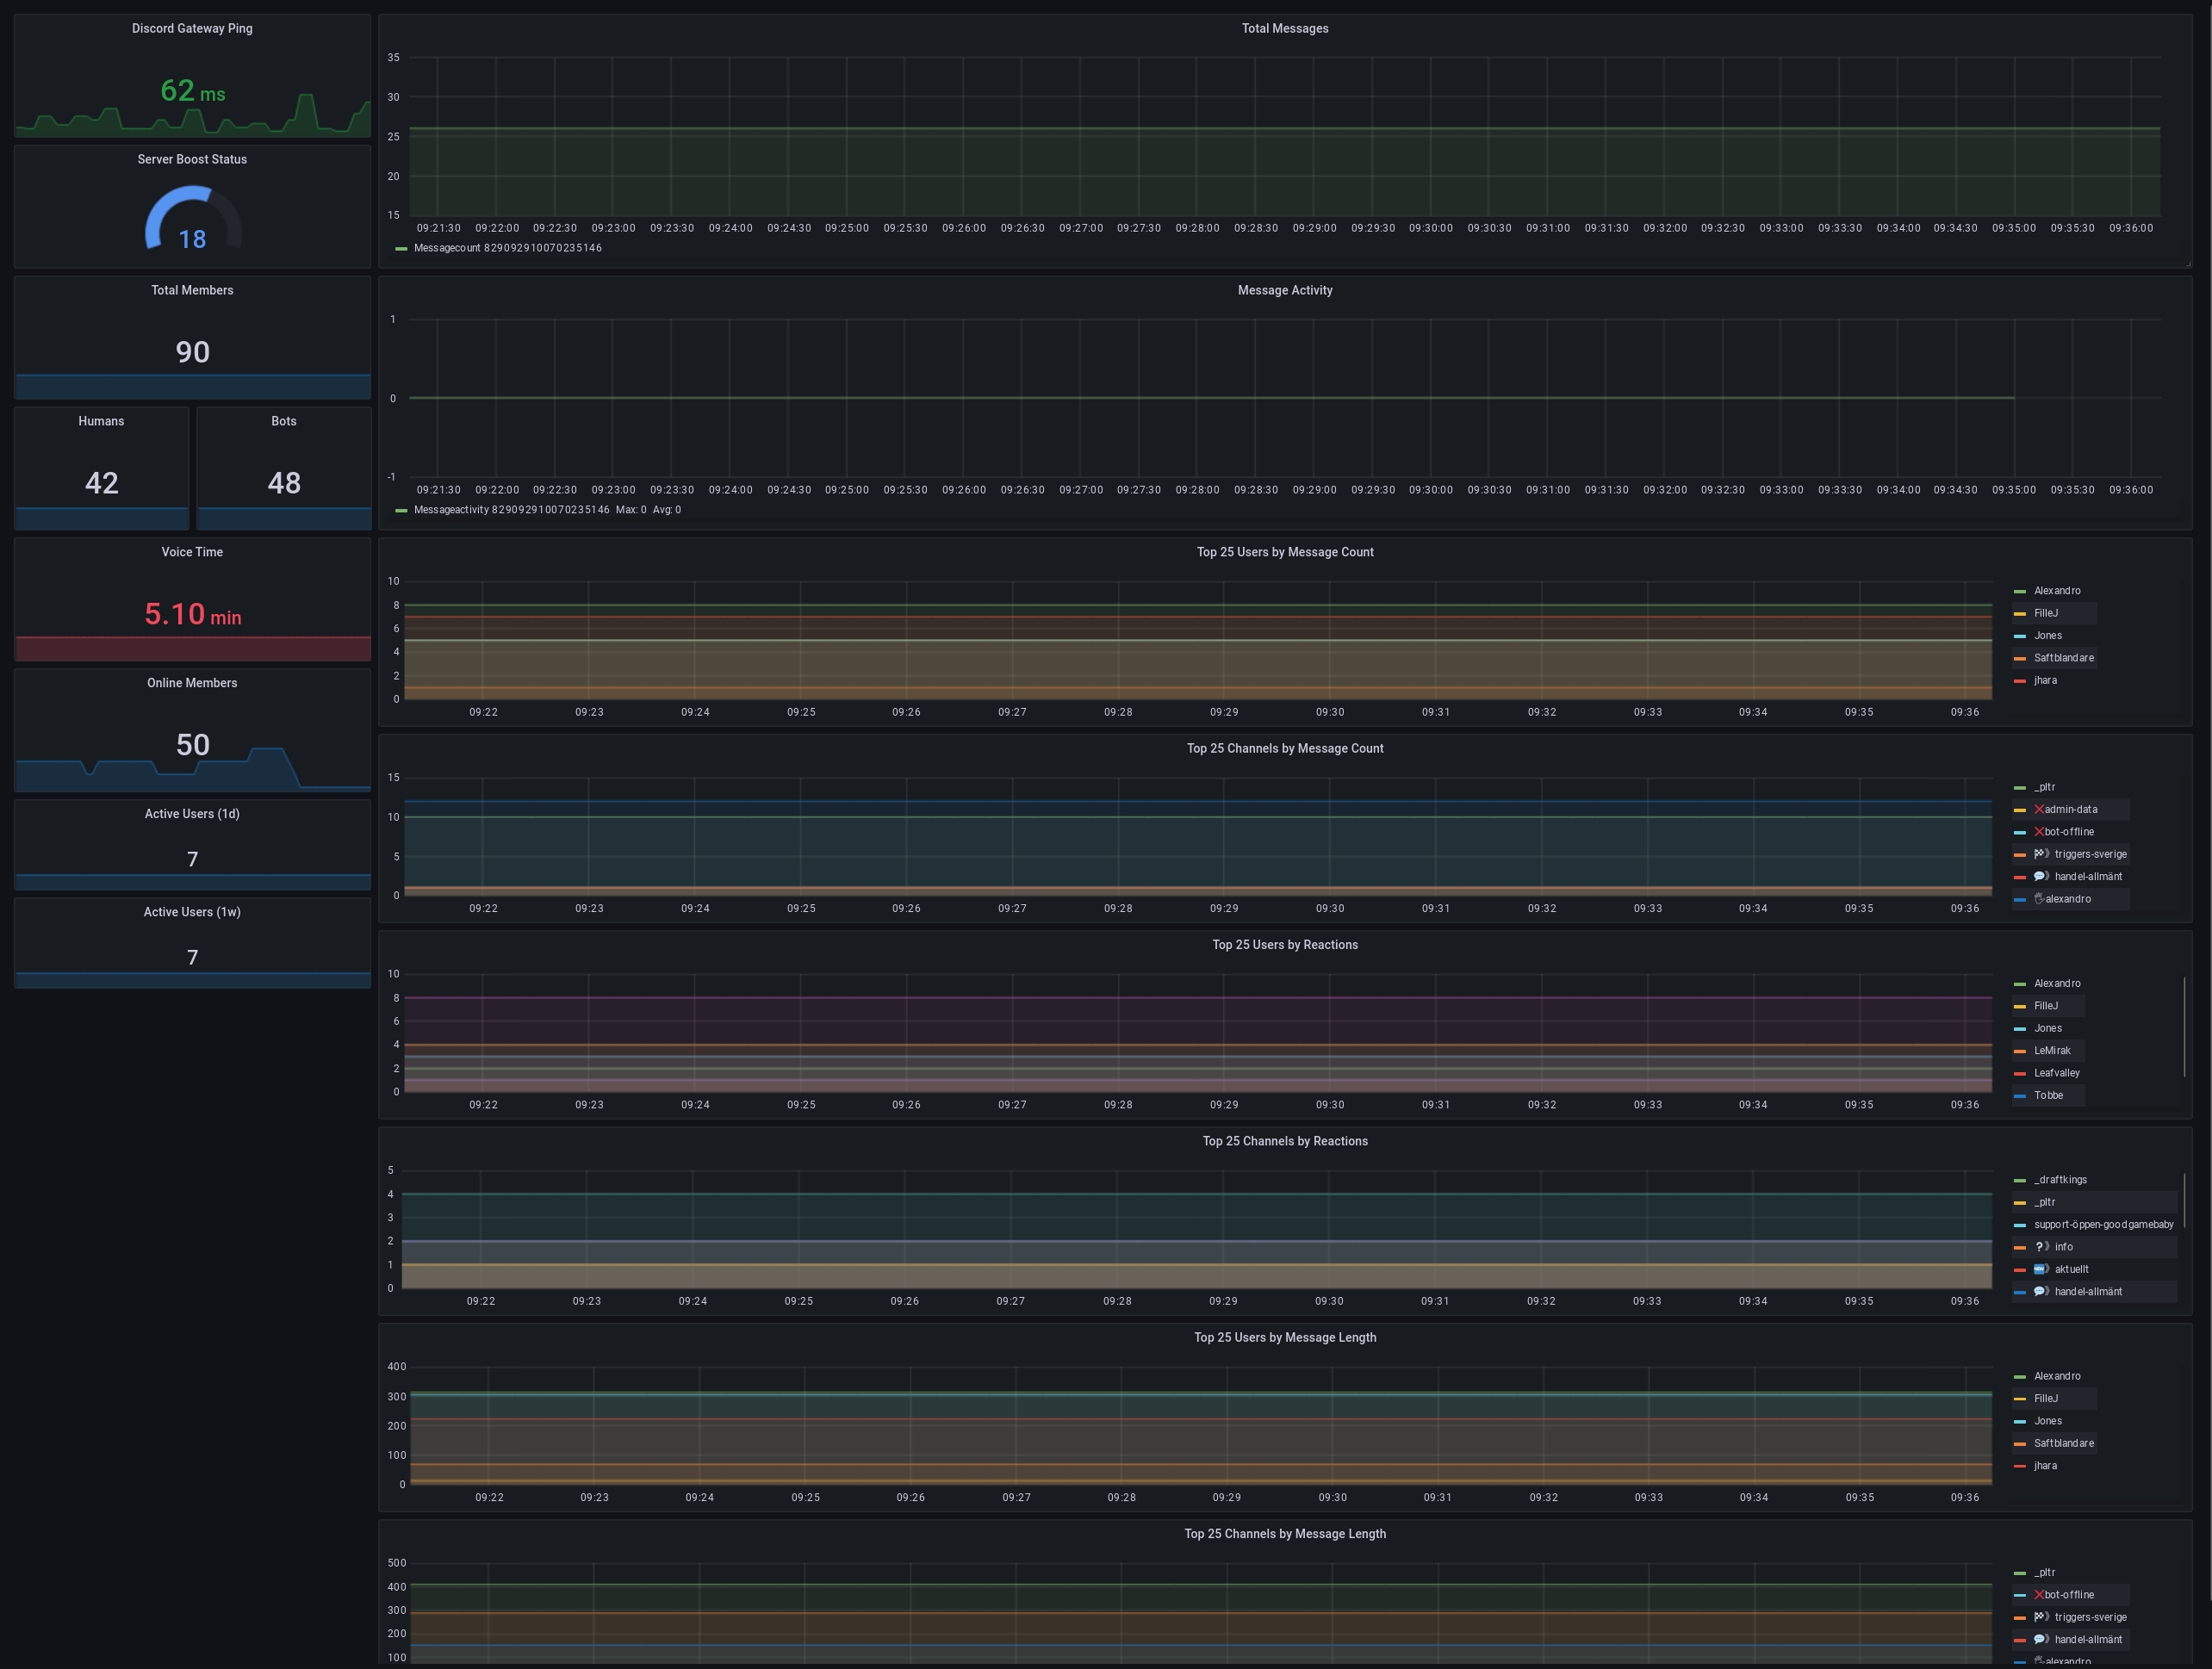
promcord + prometheus + grafana = ❤️
Self hosting
Install docker and docker-compose
Create a new discord bot (or use an existing one) that at least has read permissions to your server, and it also needs the guid and guid users intents turned on
Fill in the bot token in docker-compose.yml
Fill in your machine's IP address in prometheus.yml
Run docker-compose up -d
Navigate to grafana at http://localhost:3000
Default login is admin:admin
Add your prometheus instance as a data source in grafana, instructions here
Go back to the home page and over over the + button on the left and select import
Paste the contents of dash.json into Import via panel json
Give it a name and modify the other optional setting, and import
Once on the dashboard, go to the settings gear in the top right
Go to the variables options
Select the giud variable, and edit the Constant Options to be your guid id
Click update, return to your dashbaord, and save the current state
Enjoy your stats!
Premium hosting
I also host a managed version of grafana, and provide interested discord admins with the ability to log in and view their server stats. To get your server set up with access, do the following steps:
- Get your server id, instructions here
- Install the bot for stat collection, click here
- Send your server name and server id from step 1 to
jonesbooned#1111on discord, or the email address in my github profile page - Wait for a reply with an invite link. Use this link to sign up (you can use a fake email address)
- You are free to share this login with anyone else you want to have access
- When you login, click the magnifying glass on the left and select the graph with the same name as your server